关于如何修改坐标轴表达式以及分面图例的一个例子
ggplot2绘制的图形如果需要修改细节的话,没有对ggplot2有一定的了解的话是十分困难的,毕竟连创建这个包的作者Hadley Wickham都自称自己使用ggplot2的时候都需要查文档。在对ggplot2有一定了解的基础上如果需要修改ggplot图的话稍微查查文档基本能解决。
来源
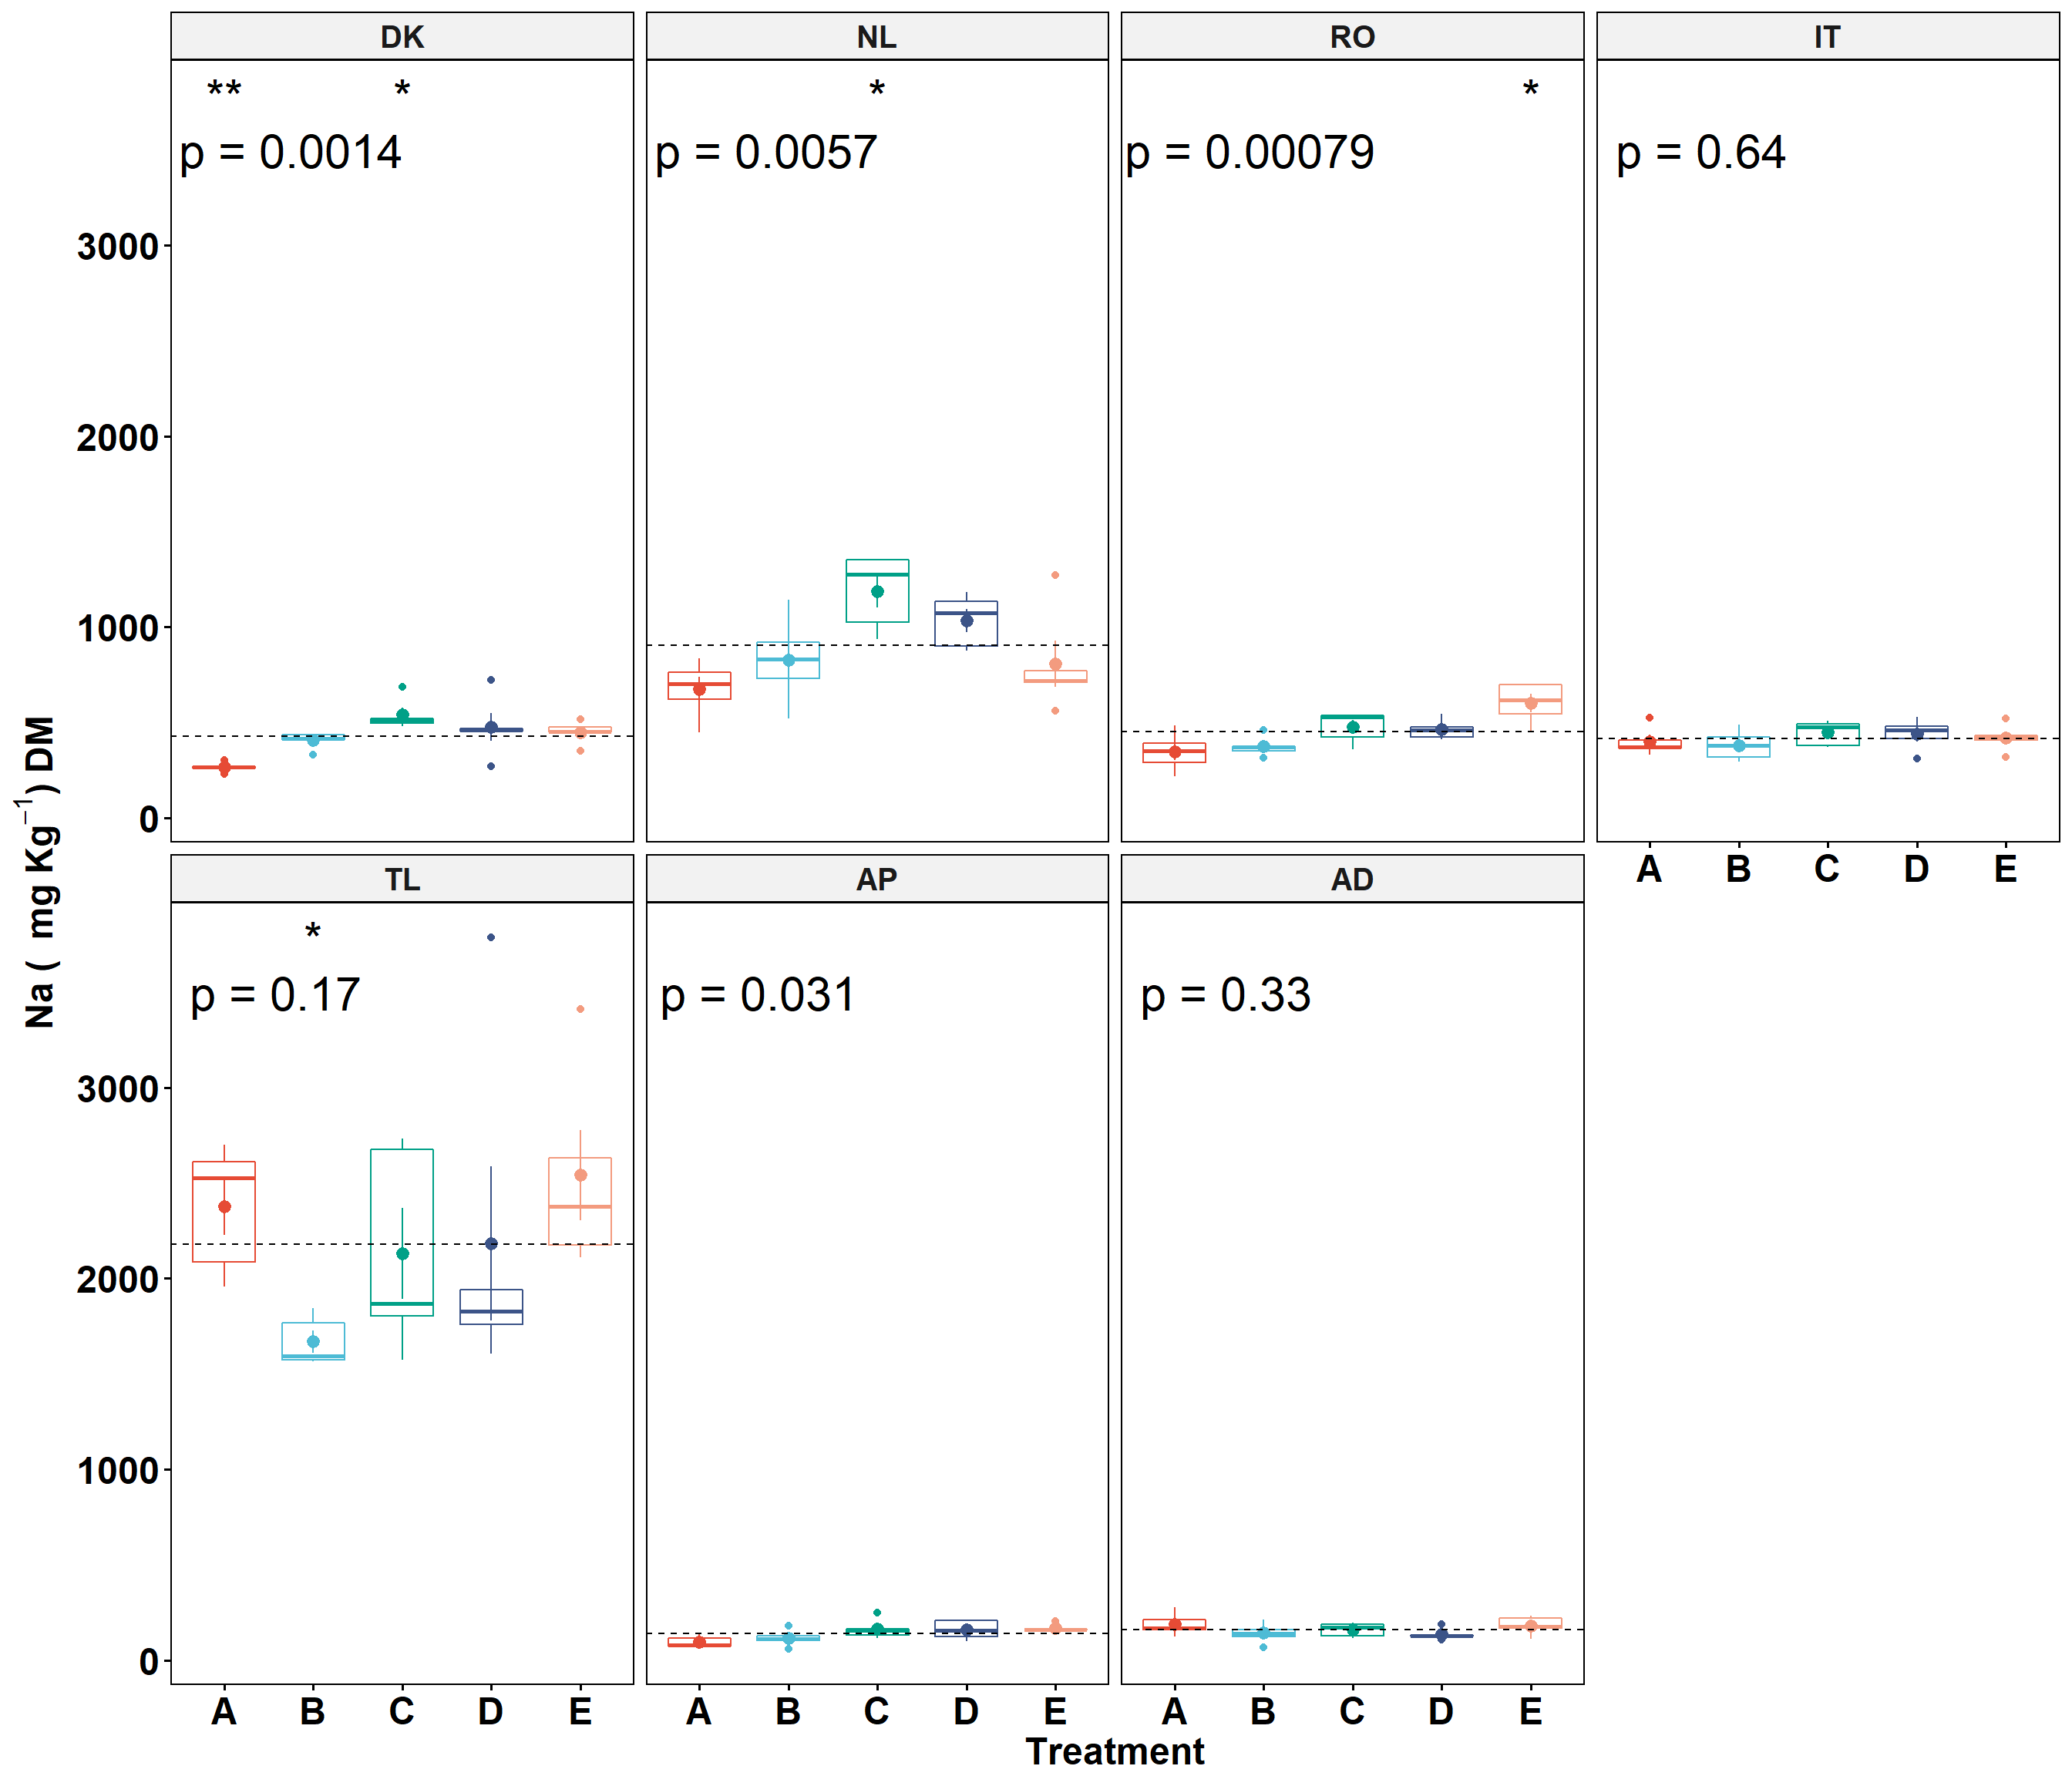
这两天有人问我如何修改她的图形,她绘制的图如下:
她希望修改三点:
-
各个分面的图例比如DK、NL等是否可以修改,使得大一点
-
Y轴标题中的-1如何变成上标
-
平均值虚线如何针对不同物种画相对应的虚线平均值
她是使用ggpubr包绘制的,这个包就是对一些ggplot2函数的一些封装及继承,本质上来说是可以通过ggplot2来修改参数的。我参考了一部分的官方文档之后解决了这三个问题,所以写了这篇博客。
数据
library(tidyverse)
library(ggpubr)
ICP<-read.csv("C:/Users/taoyan/Desktop/element.csv")
ICP$Order <- factor(ICP$Species, levels = c("DK", "NL", "RO", "IT", "TL", "AP", "AD"))
head(ICP)
##   Species Treatment       Na       Ca        P
## 1      DK         A 268.4234 3021.933 1791.317
## 2      DK         A 301.9390 3314.308 1595.479
## 3      DK         A 261.1024 3417.643 1547.596
## 4      DK         A 229.1169 3069.978 1735.703
## 5      DK         A 265.1454 3205.965 1667.524
## 6      DK         B 330.7135 4028.279 1638.113
构造数据
由于后面需要用到平均值,所以需要构造含有平均值的数据集
meanvalue <- ICP%>%group_by(Species)%>%summarise(mean=mean(Na))
data <- left_join(ICP,meanvalue,by=c('Species'='Species'))
head(data[,c(1:4,13)])
##   Species Treatment       Na       Ca     mean
## 1      DK         A 268.4234 3021.933 426.6542
## 2      DK         A 301.9390 3314.308 426.6542
## 3      DK         A 261.1024 3417.643 426.6542
## 4      DK         A 229.1169 3069.978 426.6542
## 5      DK         A 265.1454 3205.965 426.6542
## 6      DK         B 330.7135 4028.279 426.6542
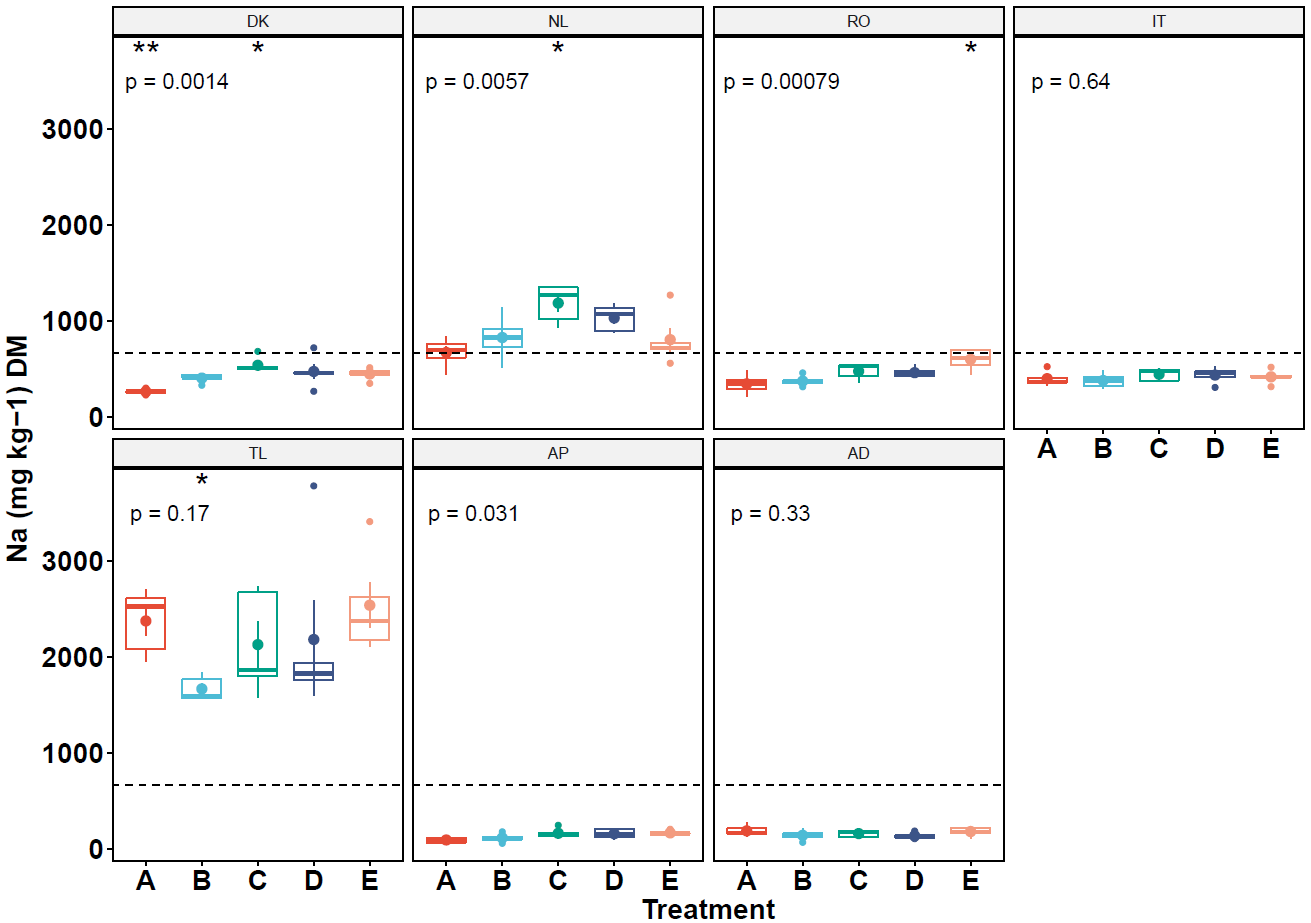
绘图
p <- ggboxplot(ICP, x="Treatment", y="Na",group="Species", color="Treatment",
add="mean_se",facet.by = "Order",ncol=4, legend="none")+
geom_hline(aes(yintercept=mean),data,linetype=2)+ #由于要在不同的分面里绘制水平线,这里要mapping
stat_compare_means(method="anova",label="p.format",label.y=3500,size=8)+
stat_compare_means(label="p.signif",size=8,method="wilcox.test",ref.group=".all.",hide.ns=TRUE)
ggpar(p,palette = "npg",font.tickslab = c(18,"bold"))+
  theme(strip.text = element_text(size=15,face = "bold"))+ #调整分面legend
  labs(x="Treatment", y=expression(bold(paste("Na (  ", 'mg Kg'^{-1},")",' DM'))))+
  theme(axis.title = element_text(face = "bold", size=18))
SessionInfo()
sessionInfo()
## R version 3.4.3 (2017-11-30)
## Platform: x86_64-w64-mingw32/x64 (64-bit)
## Running under: Windows 10 x64 (build 16299)
##
## Matrix products: default
##
## locale:
## [1] LC_COLLATE=Chinese (Simplified)_China.936
## [2] LC_CTYPE=Chinese (Simplified)_China.936
## [3] LC_MONETARY=Chinese (Simplified)_China.936
## [4] LC_NUMERIC=C
## [5] LC_TIME=Chinese (Simplified)_China.936
##
## attached base packages:
## [1] stats     graphics  grDevices utils     datasets  methods   base
##
## other attached packages:
##  [1] bindrcpp_0.2       ggpubr_0.1.6       magrittr_1.5
##  [4] forcats_0.2.0      stringr_1.2.0      dplyr_0.7.4
##  [7] purrr_0.2.4        readr_1.1.1        tidyr_0.7.2
## [10] tibble_1.4.2       ggplot2_2.2.1.9000 tidyverse_1.2.1
##
## loaded via a namespace (and not attached):
##  [1] tidyselect_0.2.3  reshape2_1.4.3    haven_1.1.1
##  [4] lattice_0.20-35   colorspace_1.3-2  htmltools_0.3.6
##  [7] yaml_2.1.16       rlang_0.1.6       pillar_1.1.0
## [10] foreign_0.8-69    glue_1.2.0        modelr_0.1.1
## [13] readxl_1.0.0      bindr_0.1         plyr_1.8.4
## [16] munsell_0.4.3     gtable_0.2.0      cellranger_1.1.0
## [19] rvest_0.3.2       ggsci_2.8         psych_1.7.8
## [22] evaluate_0.10.1   labeling_0.3      knitr_1.18
## [25] parallel_3.4.3    broom_0.4.3       Rcpp_0.12.15
## [28] scales_0.5.0.9000 backports_1.1.2   jsonlite_1.5
## [31] mnormt_1.5-5      hms_0.4.1         digest_0.6.14
## [34] stringi_1.1.6     grid_3.4.3        rprojroot_1.3-2
## [37] cli_1.0.0         tools_3.4.3       lazyeval_0.2.1
## [40] crayon_1.3.4      pkgconfig_2.0.1   xml2_1.2.0
## [43] lubridate_1.7.1   assertthat_0.2.0  rmarkdown_1.8
## [46] httr_1.3.1        rstudioapi_0.7    R6_2.2.2
## [49] nlme_3.1-131      compiler_3.4.3