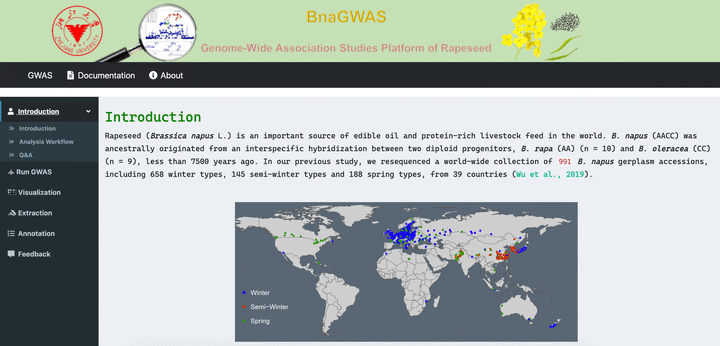
BnaGWAS
 The home page
BnaGWAS
Introduction
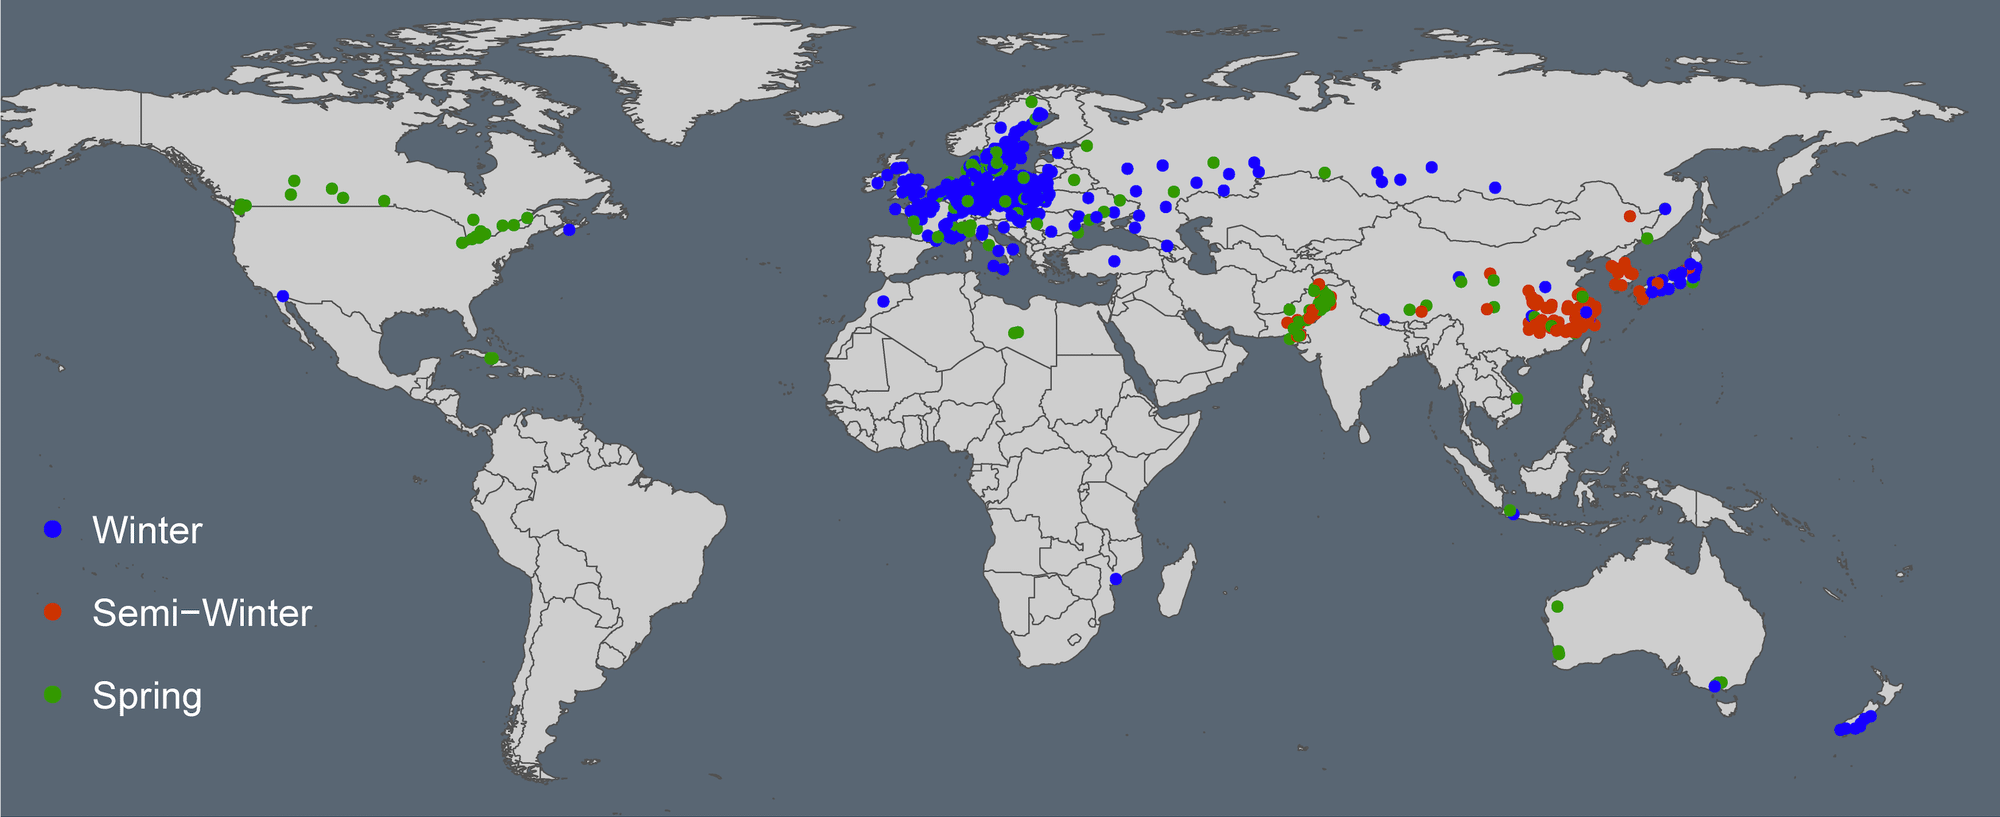
Rapeseed (Brassica napus L.) is an important source of edible oil and protein-rich livestock feed in the world. B. napus (AACC) was ancestrally originated from an interspecific hybridization between two diploid progenitors, B. rapa (AA) (n = 10) and B. oleracea (CC) (n = 9), less than 7500 years ago. In our previous study, we resequenced a world-wide collection of 1007 B. napus gerplasm accessions, including 658 winter types, 145 semi-winter types and 188 spring types, from 39 countries (Wu et al., 2019). This app is deployed at https://bnapus-zju.com/gwas for online use.
In genetics, a genome-wide association study (GWAS), also known as whole genome association study (WGAS), is an observational study of a genome-wide set of genetic variants in different individuals to see if any variant is associated with a trait. GWAS typically focus on associations between single-nucleotide polymorphisms (SNPs) and traits like major agronomic traits.
In order to make better use of this huge B. napus gerplasm accessions, we develop this interactive application (
BnaGWAS) in R with Shiny. This aaplication can conduct GWAS, visualization of GWAS results (Manhattan plot and QQ plot), extraction of significant genes and annotation of genes.
Data input
phenotype data (.txt)
Noted: Your Samples Uploaded MUST Be The 300 Core Collection Samples Used Here ! So If Some Samples Are Not In Your LIST, You Need Add Them In Your List, And Set The Value NA. If Some Samples In Your List Are Not In The 300 Core Collection Samples Here, JUST REMOVE THEM!
I highly recommended first download the example of the expected input phenotype dataset below, and then replace the phenotype values with you own data.
You just need upload your phenotype data to run GWAS. Here we just use the 300 core collection gerplasm which represent the most of genetic resources of 1000 B. napus gerplasm accessions. an example of the expected input data format is present as below:
| R4157 | 0.859791123 |
| R4158 | 0.87369142 |
| R4163 | 0.842593709 |
| R4168 | 0.884782609 |
| R4171 | NA |
| R4176 | 0.885619807 |
| R4177 | 0.885884455 |
| R4179 | 0.879374612 |
| R4180 | 0.878567797 |
| R4182 | 0.868825911 |
| … | … |
Where, column one correspond to samples, column two correspond to phenotype values.
An example of the expected input phenotype dataset can be accessible here.
Other parameters
Next you need enter your trait name (recommended) (default: Bna_trait). Now just support the EMMAX model. After all the prepared works are ready, then clink Run Analysis to start GWAS.
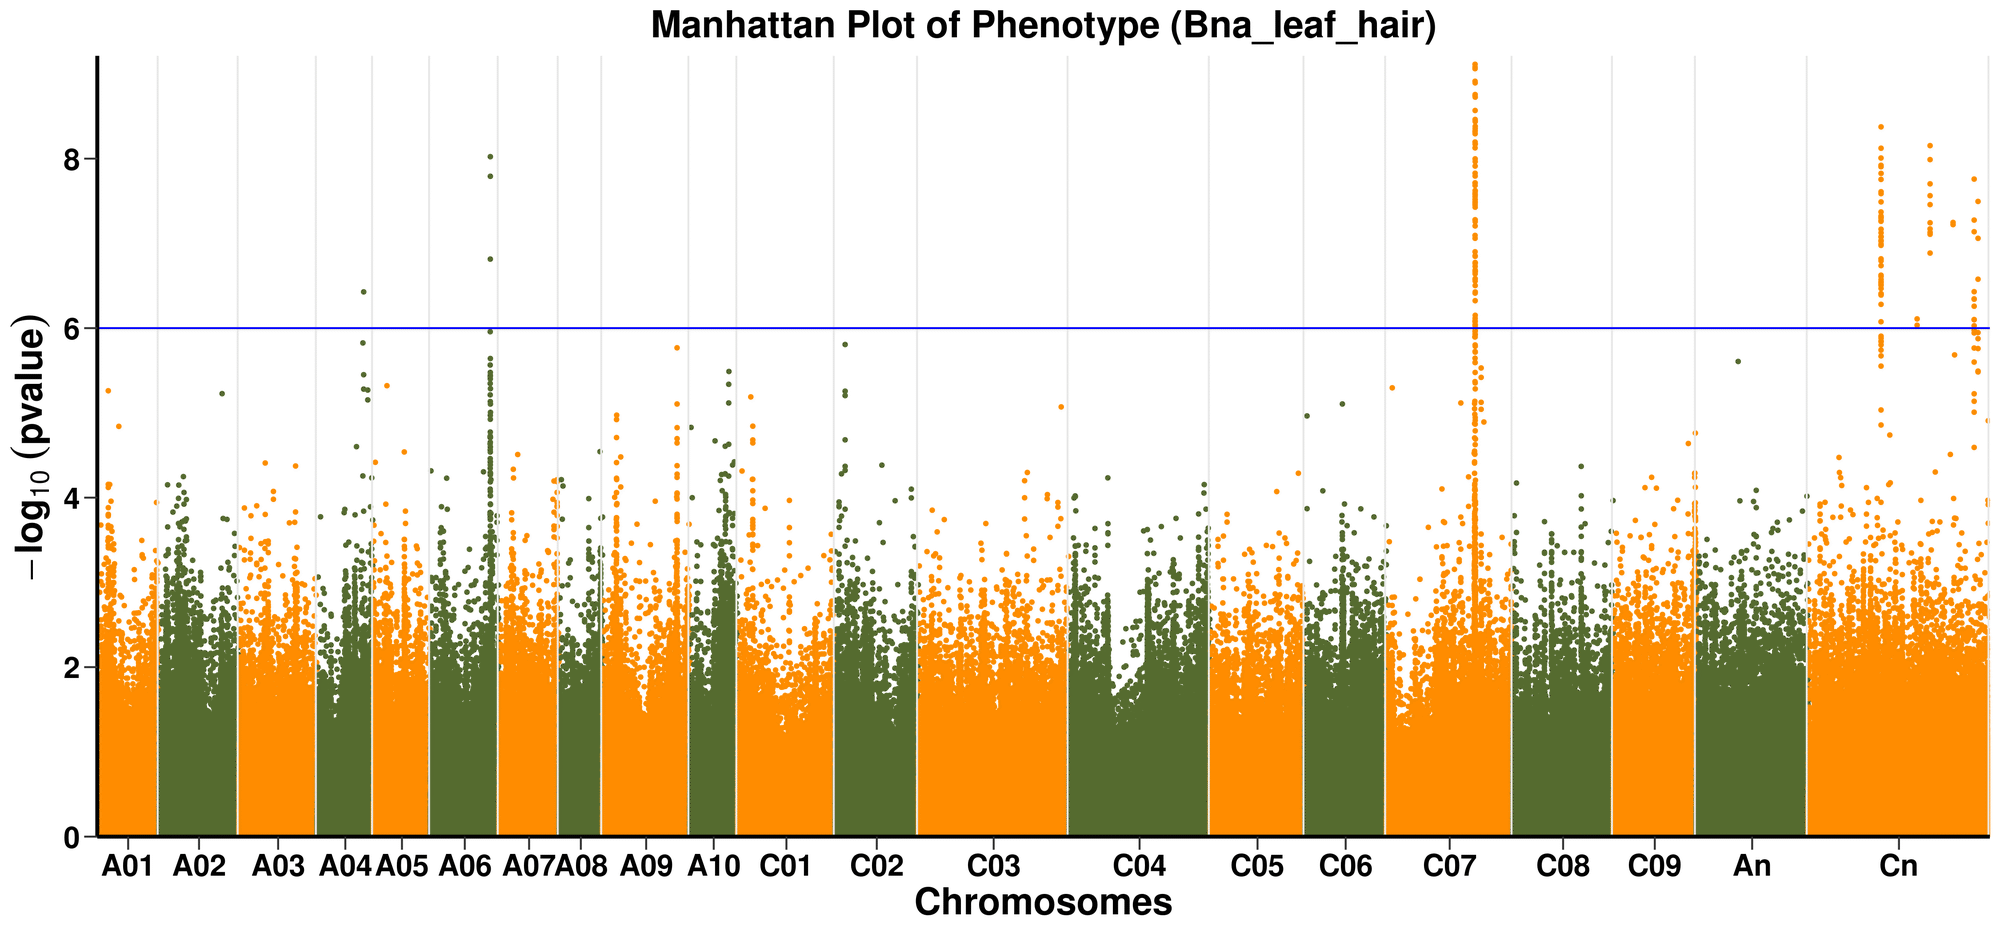
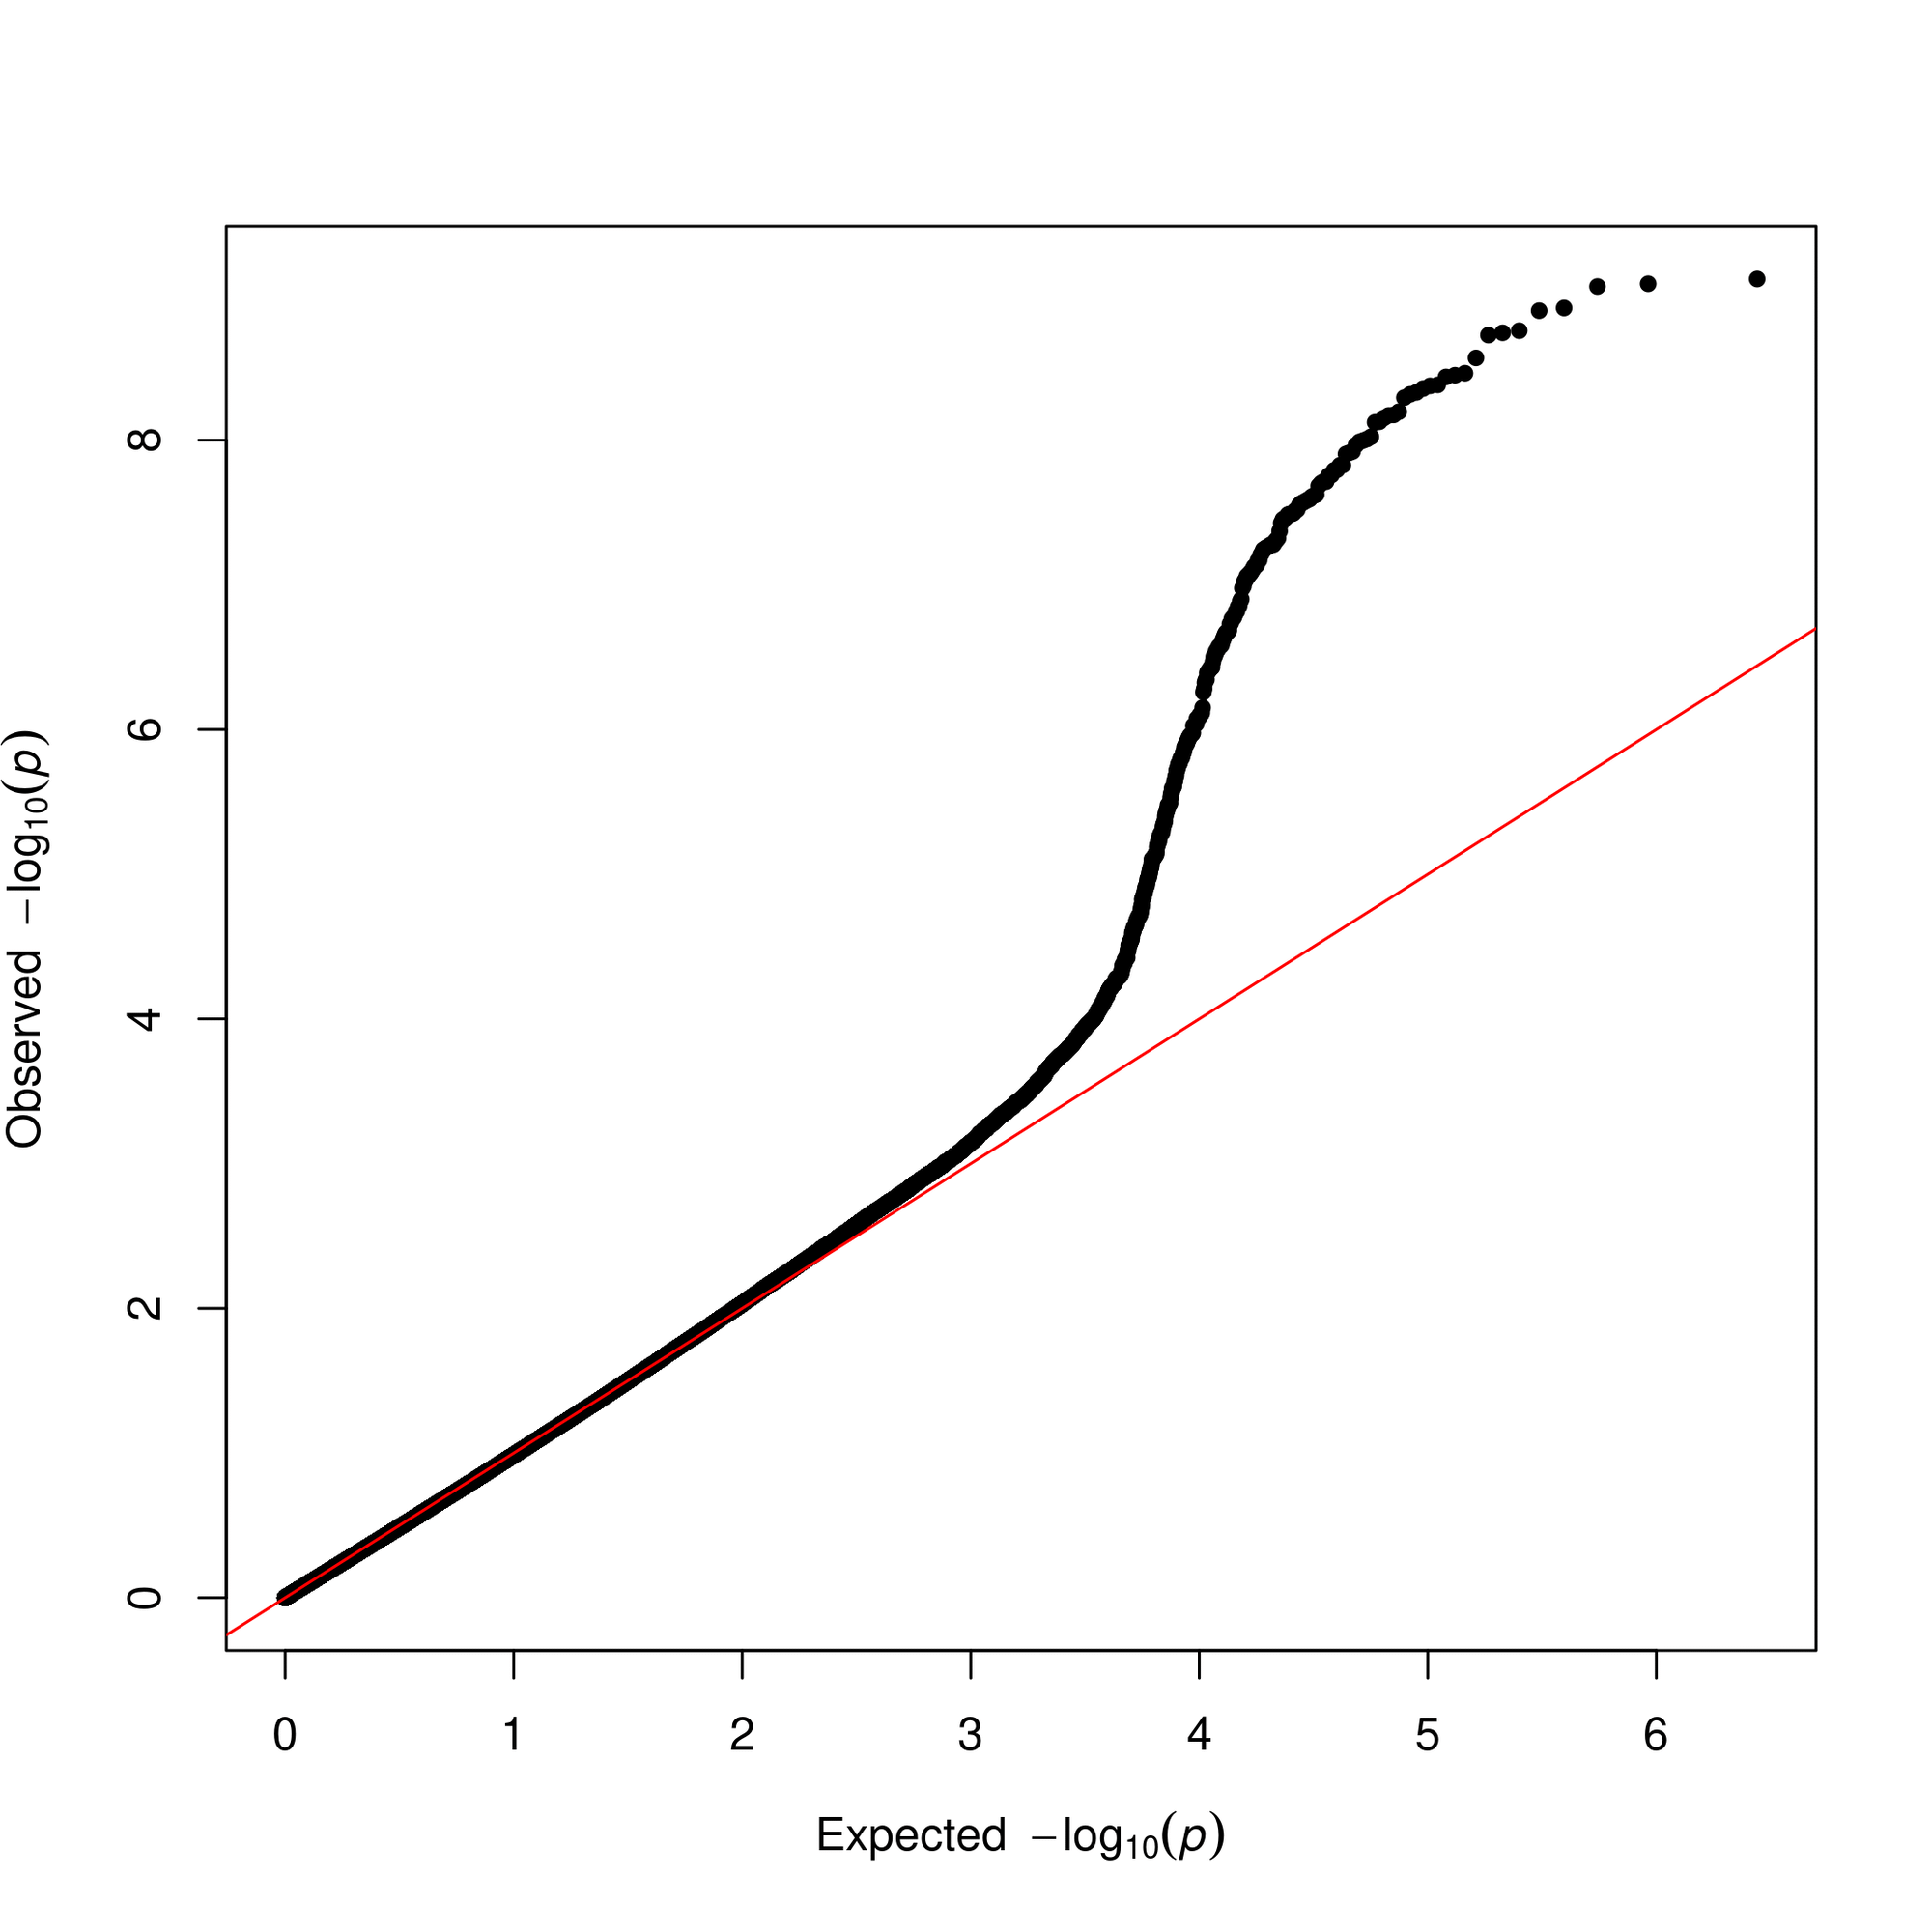
Visualization
For the Visualization section in this App, it is aiming to visualize the Manhattan plot and QQ plot. You can choose the alternate colors for alternate chromosomes and p-value threshold (default: p-value=5).
Extraction
The extraction of significant genes is based on the significant p-value of SNPs. So here you need choose the p-value threshold and the distance up/down-stream of SNPs (recommended) (default: 75kb).
Annotation
This section is designed for gene annotation based on different databases (eggNOG, GO, KEGG, NR, etc.).