Shiny学习笔记:UI之输出

输出
有输入就有输出,前端的每一个output都对应着后端的一个render函数。Shiny主要有三类输出:文本,表格以及图。
文本输出
文本输出函数有两个:textOutput(),verbatimTextOutput(),区别是:
VerbatimTextOutput uses the HTML pre tag. The pre tag uses a fixed-width font (e.g. Courier) and does not modify line breaks and spaces. Therefore this is excellent to present formatted text such as code.
TextOutput uses the div tag. The div tag does not necessarily use a fixed-width font (unless you use specific CSS). It also does not keep line breaks and multiple spaces in the same way that pre does. This is more suited for prose.
library(shiny)
ui <- fluidPage(
  textOutput("text"),
  verbatimTextOutput("code")
)
server <- function(input, output, session) {
  output$text <- renderText("Hello friend!")
  output$code <- renderPrint(summary(1:10))
}
shinyApp(ui, server)

文本输出对应两种render函数:
- renderText() which displays text returned by the code.
- renderPrint() which displays text printed by the code.
表格输出
表格输出有两种选择:
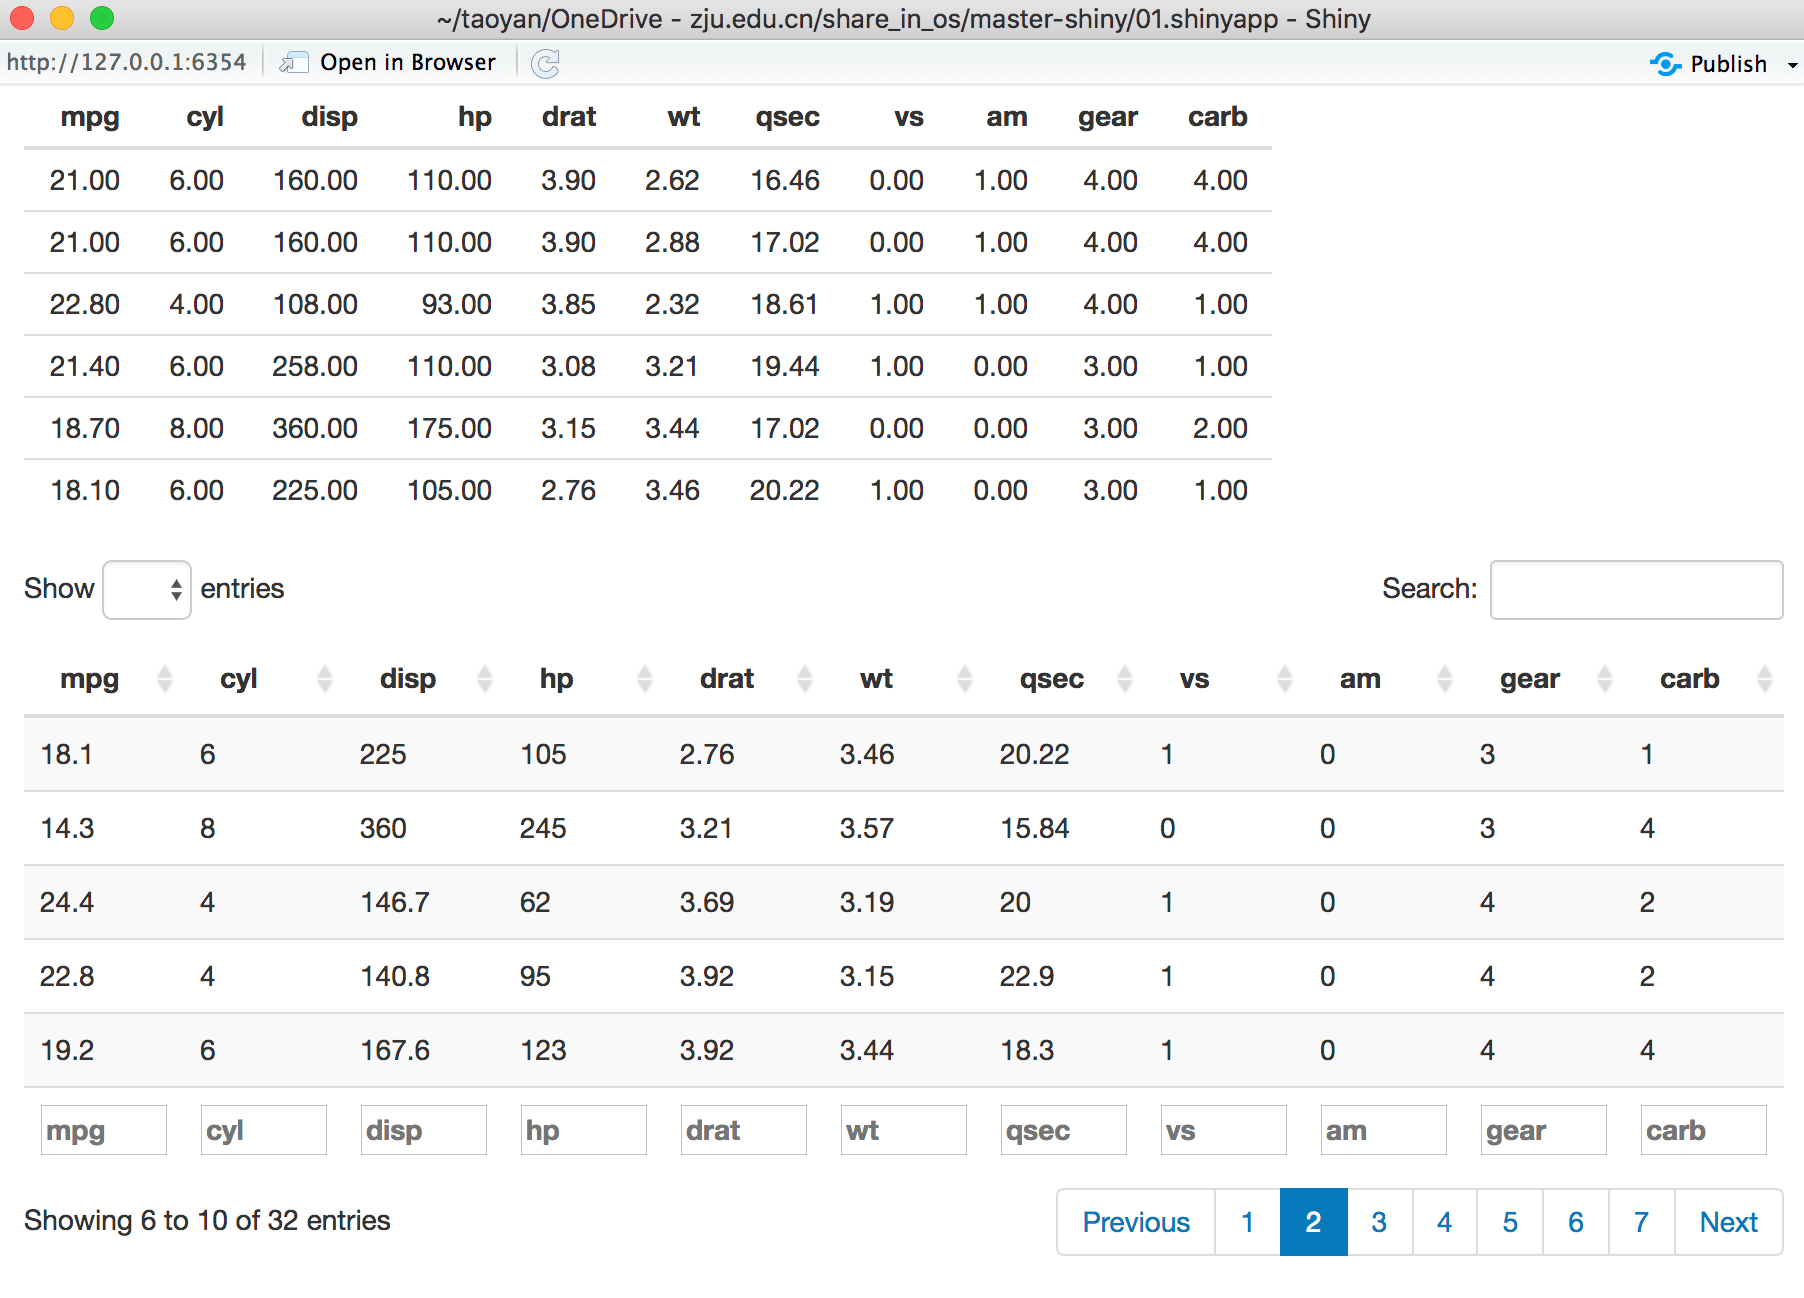
tableOutput()与renderTable():静态输出,一次性输出所有数据,适用于小数据集dataTableOutput()与renderDataTable():动态输出,有选择性地控制输出,适用于展示大数据集
library(shiny)
ui <- fluidPage(
  tableOutput("static"),
  dataTableOutput("dynamic")
)
server <- function(input, output, session) {
  output$static <- renderTable(head(mtcars))
  output$dynamic <- renderDataTable(mtcars, options = list(pageLength = 5))
}
shinyApp(ui, server)

图形输出
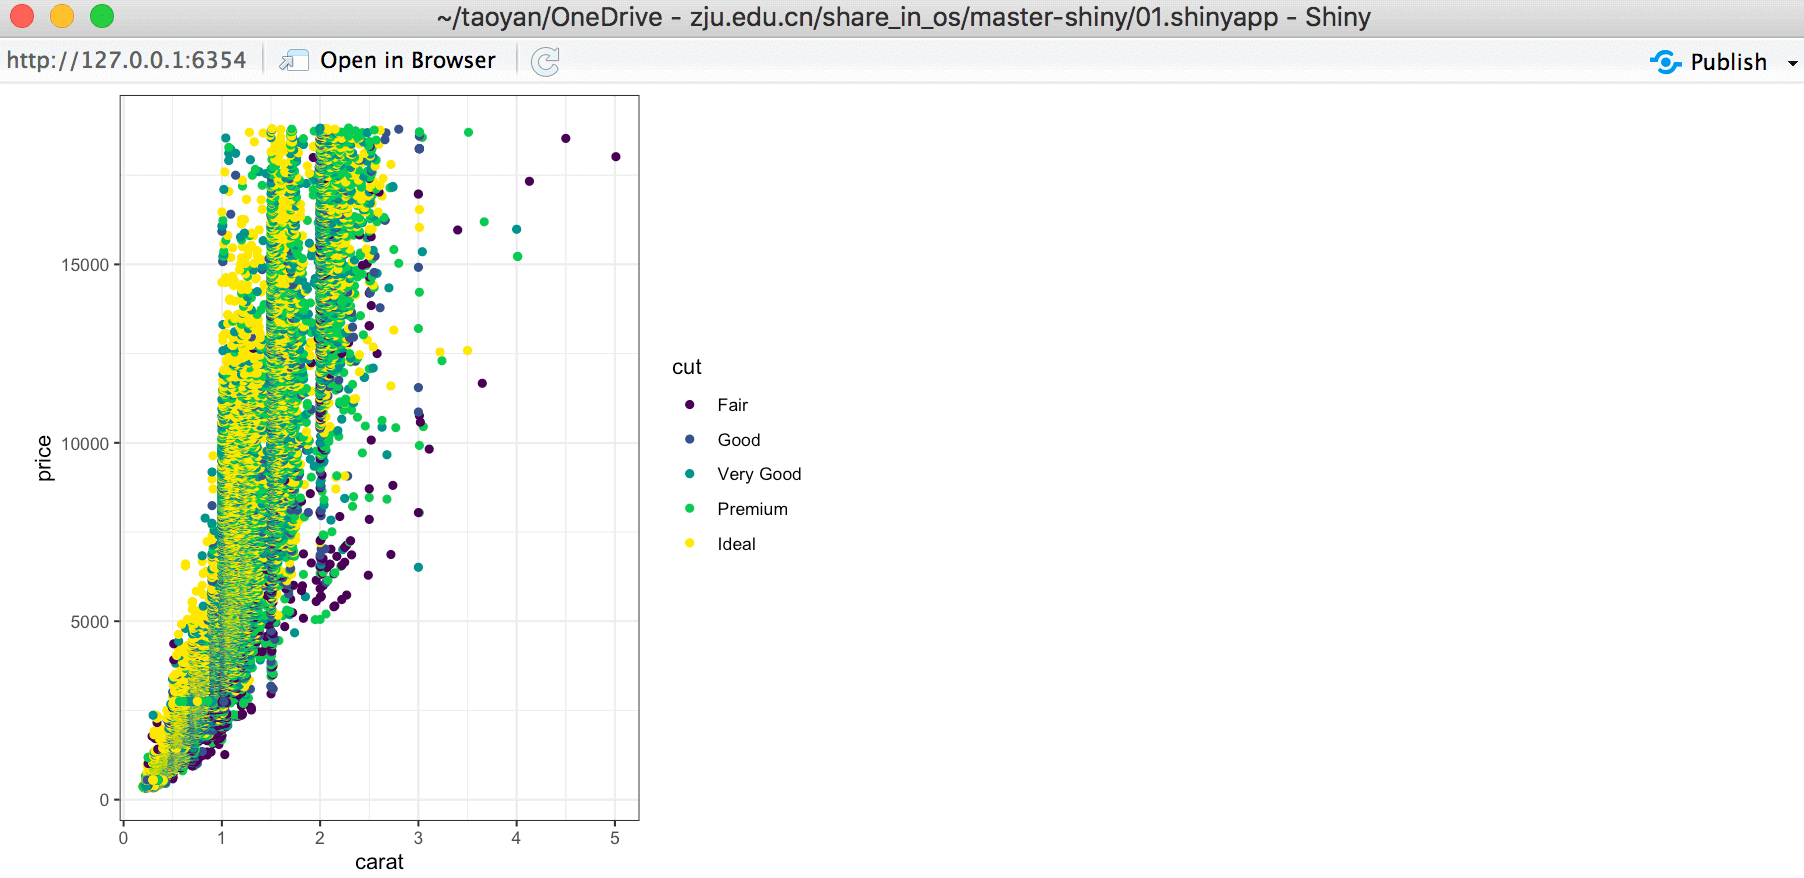
所有的图形都可以用plotOutput()与renderPlot()输出
library(shiny)
library(ggplot2)
ui <- fluidPage(
  plotOutput("plot", width = "400px")
)
server <- function(input, output, session) {
  output$plot <- renderPlot({
    ggplot(diamonds,aes(carat,price))+
      geom_point(aes(color=cut))+
      theme_bw()
  })
}
shinyApp(ui, server)

参考:https://mastering-shiny.org/basic-ui.html